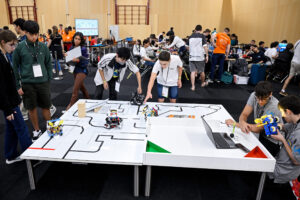
I came to the Silicon Valley region in 2010 because I knew it was the robotics center of the world, but it certainly doesn’t get anywhere near the media attention that some other robotics regions do. In California, robotics technology is a small fish in a much bigger technology pond, and that tends to conceal
I came to the Silicon Valley region in 2010 because I knew it was the robotics center of the world, but it certainly doesn’t get anywhere near the media attention that some other robotics regions do. In California, robotics technology is a small fish in a much bigger technology pond, and that tends to conceal how important Californian companies are to the robotics revolution.
This conservative dataset from Pitchbook [Vertical: Robotics and Drones] provides data for 7166 robotics and drones companies, although a more customized search would provide closer to 10,000 robotics companies world wide. Regions ordered by size are:
North America 2802
Asia 2337
Europe 2285
Middle East 321
Oceania 155
South America 111
Africa 63
Central America 13
USA robotics companies by state
California = 843 (667) * no of companies followed by no of head quarters
Texas = 220 (159)
New York = 193 (121)
Massachusetts = 191 (135)
Florida = 136 (95)
Pennsylvania = 113 (89)
Washington = 85 (61)
Colorado = 83 (57)
Virginia = 81 (61)
Michigan = 70 (56)
Illinois = 66 (43)
Ohio = 65 (56)
Georgia = 64 (46)
New Jersey = 53 (36)
Delaware = 49 (18)
Maryland = 48 (34)
Arizona = 48 (37)
Nevada = 42 (29)
North Carolina = 39 (29)
Minnesota = 31 (25)
Utah = 30 (24)
Indiana = 29 (26)
Oregon = 29 (20)
Connecticut = 27 (22)
DC = 26 (12)
Alabama = 25 (21)
Tennessee = 20 (18)
Iowa = 17 (14)
New Mexico = 17 (15)
Missouri = 17 (16)
Wisconsin = 15 (12)
North Dakota = 14 (8)
South Carolina = 13 (11)
New Hampshire = 13 (12)
Nebraska = 13 (11)
Oklahoma = 10 (8)
Kentucky = 10 (7)
Kansas = 9 (9)
Louisiana = 9 (8)
Rhode Island = 8 (6)
Idaho = 8 (6)
Maine = 5 (5)
Montana = 5 (4)
Wyoming = 5 (3)
Mississippi = 3 (1)
Arkansas = 3 (2)
Alaska = 3 (3)
Hawaii = 2 (1)
West Virginia = 1 (1)
South Dakota = 1 (0)
Note – this number in brackets is for HQ locations, whereas the first number is for all company locations. The end results and rankings are practically the same.
ASIA robotics companies by country
China = 1350
Japan = 283
India = 261
South Korea = 246
Israel = 193
Hong Kong = 72
Russia = 69
United Arab Emirates = 50
Turkey = 48
Malaysia = 35
Taiwan = 21
Saudi Arabia = 19
Thailand = 13
Vietnam = 12
Indonesia = 10
Lebanon = 7
Kazakhstan = 3
Iran = 3
Kuwait = 3
Oman = 3
Qatar = 3
Pakistan = 3
Philippines = 2
Bahrain = 2
Georgia = 2
Sri Lanka = 2
Azerbaijan = 1
Nepal = 1
Armenia = 1
Burma/Myanmar = 1
Countries with no robotics; Yemen, Iraq, Syria, Turkmenistan, Afghanistan, Syria, Jordan, Uzbekistan, Kyrgyzstan, Tajikistan, Bangladesh, Bhutan, Mongolia, Cambodia, Laos, North Korea, East Timor.
UK/EUROPE robotics companies by country
United Kingdom = 443
Germany = 331
France = 320
Spain = 159
Netherlands = 156
Switzerland = 140
Italy = 125
Denmark = 115
Sweden = 85
Norway = 80
Poland = 74
Belgium = 72
Russia = 69
Austria = 51
Turkey = 48
Finland = 45
Portugal = 36
Ireland = 28
Estonia = 24
Ukraine = 22
Czech Republic = 19
Romania = 19
Hungary = 18
Lithuania = 18
Latvia = 15
Greece = 15
Bulgaria = 11
Slovakia = 10
Croatia = 7
Slovenia = 6
Serbia = 6
Belarus = 4
Iceland = 3
Cyprus = 2
Bosnia & Herzegovina = 1
Countries with no robotics; Andorra, Montenegro, Albania, Macedonia, Kosovo, Moldova, Malta, Vatican City.
CANADA robotics companies by region
Ontario = 144
British Colombia = 60
Quebec = 53
Alberta = 34
Manitoba = 7
Saskatchewan = 6
Newfoundland & Labrador = 2
Yukon = 1
Regions with no robotics; Nunavut, Northwest Territories.